
Introduction to the BCG matrix
Although the agile movement is product-centric, for a long time it focused on a single product. This is also the case with the most widely used agile methodology, Scrum, which can be a great framework for a product development team, but its shortcomings can become apparent when multiple products are developed in parallel. You don’t have to be a huge company to have multiple products, uncomfortable questions can often arise even with two products: which product is more important (now)? Which one do we develop? How do we prioritise the development tasks of the products in relation to each other?
The need for scaling agile methodologies and frameworks has perhaps drawn the most attention to the above issues, but there are also some scaled agile methodologies that do not provide detailed, practical solutions to these problems. SAFe is perhaps the best at addressing this issue, in this framework a separate (optionally usable) level has been created for the product portfolio, with a number of tools for its agile management.
Another simple way of managing a product portfolio is the so-called BCG matrix, named after its creators, the Boston Consulting Group..
The BCG Matrix
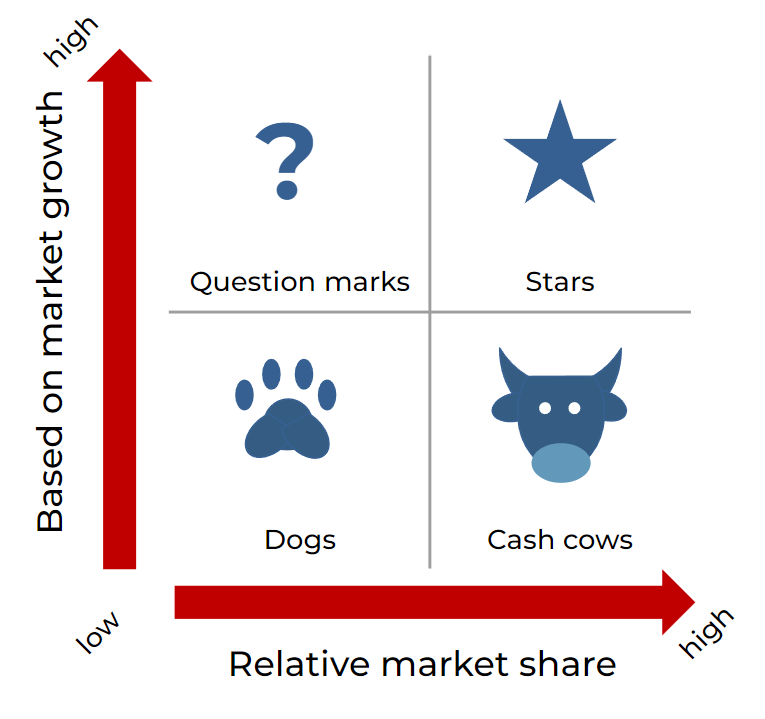
The BCG matrix is a simple analysis method that examines the members of an organisation’s product portfolio according to two criteria:
– relative market share and
– based on market growth.
By classifying the company’s products as low or high according to the above criteria, four groups are obtained:
– Stars
– Cash cows
– Question marks and
– Dogs
 The purpose of the BCG matrix
The BCG matrix is a tool for strategic analysis. It aims to:
– identify the position of each of the organisation’s products on the product life cycle curve,
– determine the optimal market positioning and development strategy for a given product,
– examine the position of products in relation to each other,
– and develop the optimal product portfolio for the moment according to these.
Product life cycle
Development
Intro
Growth
Maturity and saturation
Decline
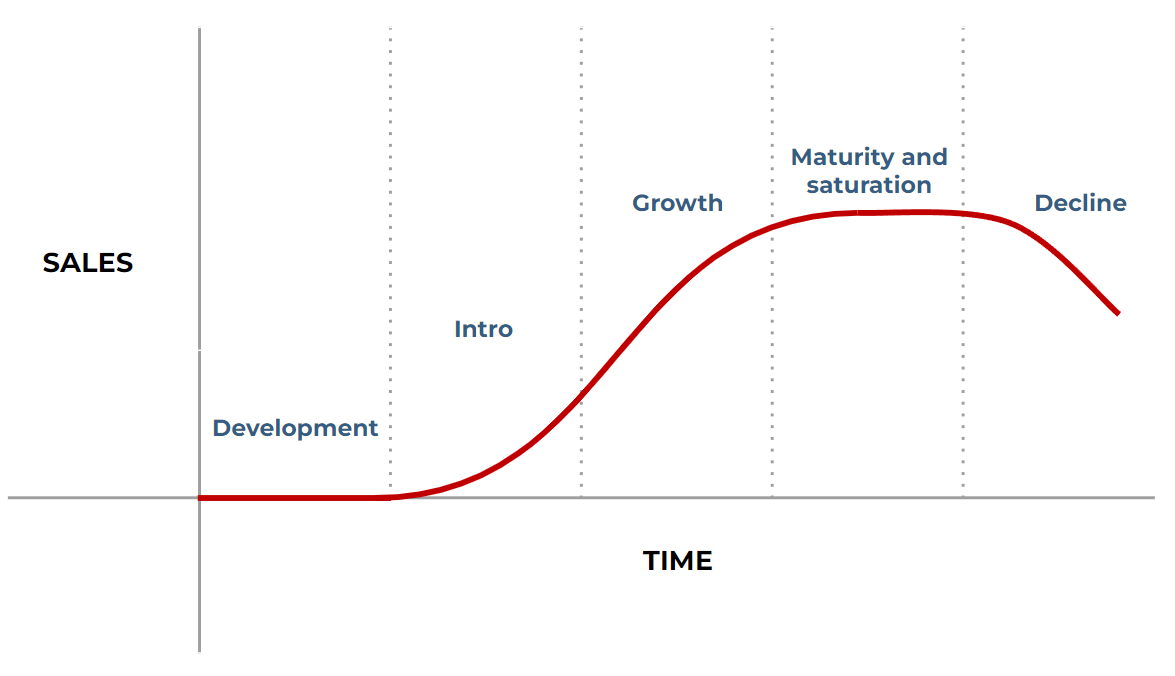
To understand the BCG matrix, it is important to refresh the reader’s knowledge of the product life cycle curve. The classic product life cycle curve distinguishes four phases. In our diagram, the zero phase, called development, appears, indicating the importance of this activity. Of course, in an agile environment, product development does not end with market entry. Therefore, it is particularly important for agile organisations to know the position of each product on the product life cycle curve, as this will help them to determine how long and how much effort is worth investing in further product development.
The phases of the product life curve:
– Intro: the product is new, its market performance and success is still questionable. The main task is to introduce the product to the market, to test the product and its unique selling point.
– Growth: in case of a successful launch, the product will find its customers, the early adopters will be followed by the early majority, sales will increase, and at the same time competitors and followers will appear.
– Maturity and saturation: usually the longest stage of the product life cycle. By the time the product reaches this stage, competition is fierce and continuous innovation is needed to maintain and increase market position.
– Decline: the market for the product shrinks, the product becomes uninteresting or obsolete. Development is closed down, the organisation’s resources are devoted to developing new products.
Parts and categories of the BCG matrix
Stars
The product has a high market share in an expanding market (high market growth), this is the growth phase of the product life cycle. Star products have high business potential, this is the most fortunate strategic position. The challenge for these products is to meet the needs of an expanding market (which may involve high development costs) and to maintain and increase the advantage gained over competitors, which usually justifies further development.
Star products are therefore in a prominent position in the product portfolio. The aim is to maintain their success and, over time, to become a mainstay, thereby generating more profit.
Cash cows
Products with a high market share in a slowing market are the so-called “headstones”, in the maturity phase of their life cycle. The aim is to maintain this state in the long term, to maximise profits. Development costs for this group are low but not disappearing. An important task is to follow up, support, even update and issue updates.
Developers are able to generate high profits with low development costs, thus covering the development costs of new products.
Question marks
Products with a low share of a dynamic growth market are the question marks, in the first phase of the product life curve (Introduction). They have great potential to become star products over time, but may require a large investment. An agile mindset is particularly important for these products: incremental development, regular delivery, continuous feedback can go a long way to ensure that the product is on the right track to increase its market share and to recognise as early as possible that if the product fails to deliver, it cannot become a star.
Dogs
A slowing or shrinking market, low market share, a phase of decline. These products are often unprofitable, and from a portfolio management point of view, stopping development and withdrawing the product is often the appropriate step.
BCG matrix examples
There are countless examples of BCG matrices created by consulting firms on products of well-known companies. It is particularly interesting to compare matrices produced by different companies on the same products. In our selection, Apple is the most popular test subject:

– BCG matrices for Coca-Cola, Samsung, L’Oreal, PepsiCo, Apple, Nestlé, Unilever, McDonald’s, KFC and Amazon have been created on this page:
– Products from PepsiCo, Apple and L’Oreal are tested with the BCG matrix on the following page
– Toyota BCG matrix
– And another Apple BCG matrix
Advantages and disadvantages
The BCG matrix is a simple, quick and easy to use tool. As is usually the case with such tools, they are limited in their usefulness, as the number of criteria to be tested is small. A BCG matrix can be suitable for a quick overview, but for very complex product portfolios, for example where further prioritisation within categories is essential, more complex tools should be used. These could be, for example:
– the Scaled Agile Framework portfolio level tools
– the PESTEL, STEEP or STEEPLE analysis,
– the Business model canvas, which you can learn more about in our Advanced Product Owner training.
The biggest danger of the BCG matrix is that it is static, always showing only the state that is true or perceived to be true at the time of its creation. Therefore, when used, it is worth repeating the analysis frequently.