
What are metrics and how do you use them?
There are a lot of misconceptions about metrics inside and outside of the agile world. Metrics are tools providing feedback about one single aspect of an area under surveillance, and nothing more. They are not goals. It is dangerous to derive conclusions based on a single number or a single chart, without understanding the circumstances and the situation. This would be comfortable and fast, but also extremely risky. A metric can (but not always does) reveal problems and usually cannot point out the root causes.
Let’s take a look at a concrete example. A training participant reported that due to budget cuts, one of their teams had to be removed from their project, and the team to be discarded was selected by looking at burn-down charts. She asked our opinion about this solution. We told her that it was probably a huge mistake. Why?
Let’s suppose we have these two burn-down charts:
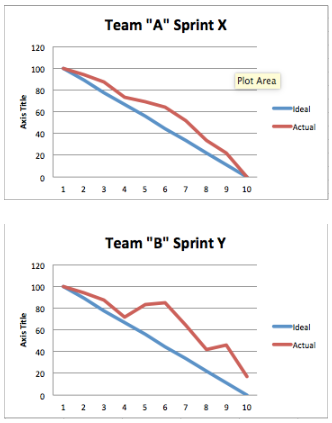
Let’s also suppose that the charts had shown similar characteristics for the last eight sprints. If we only take these metrics into consideration, most people would say that Team A is performing better, so obviously this is the team to keep. Why? Because the arc of the curve is ideal, it decreases constantly, all tasks are finished by the end of the sprint. In short, it looks like every committed story has been delivered.
What is the catch then?
Without attempting to be comprehensive, let’s think about what can hide behind these burn-down charts:
• Too many successful sprints in a row are a bit dubious. Maybe Team A is under committing for the sprints, and that’s the reason for their success?
• Why does Team B have so many unfinished sprints?
• Are their estimations inaccurate?
• Are they over committing regularly?
• Are their backlog items of poor quality, making planning overly difficult?
• Are there too many details which are only uncovered mid-sprint?
• Are there external dependencies blocking their delivery?
• Team B’s chart shows periods of uprising. What can that mean?
• Poor task breakdown?
• Testing uncovers bugs during the sprint? If yes, why is there no similar effect at Team A? Maybe Team A is not testing properly during the sprint, and there are a lot of escaped defects in their delivered features?
Therefore the same chart can mean multiple things, and not all of them are in the responsibility of the team. Metrics should be handled with care! The proper way of handling them is:
• Select the appropriate metrics
• Independent of whether they look good or bad, take time to understand what is going on. This step cannot be skipped, so go to where the work is performed and ask the proper questions (for example the ones listed above).
We could list agile metrics by the dozens, but of course it is not advisable to use all of them all the time. Some rules of thumb for choosing the right metrics:
Metrics can be introduced for specific situations by a person having a close view of the affected process. This can be the Scrum Master in case of Scrum. A concrete example: a Scrum Development Team complained about being unable to work in proper Scrum because of the business side changing the content of the backlog items on a daily basis. Their work was unplannable, they regularly threw away half complete features and that frustrated them. Our sympathy was with the team, but we could not console them, because we told the team that if we were in the shoes of the business side, we’d done the same. Why? What business sees in this case is that all of their requests are implemented by the Development Team. This is a very comfortable situation, there is absolutely no drive to change their behavior. “Ok, developers are complaining, but developers are always complaining, this is just business as usual…”
The solution in this case is to look for a metric which makes the problems caused by this behavior obvious. Therefore we have asked the team to collect the amount of work which was wasted each sprint due to the continuously changing requirements. With this data at hand, the business side could see that although all of their wishes were granted, if they would have been able to plan for two weeks ahead (not an impossible request), there could have been more than twice as much work delivered. This proved to be a strong and convincing argument.
• The above example has described temporary metrics. Of course there are also metrics which need to be evaluated continuously. The following matrix can come in handy in selecting them.
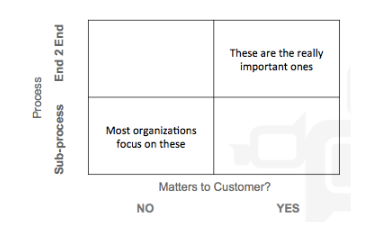
The rows of the matrix indicate the scope of the measured process, whether it is a sub-process (development, testing, operations, etc.) or is it the end-2-end value stream. Columns indicate whether the metric matters to the customer. By customer, we mean the buyer of the delivered product, not the contractor in case of an outsourcing or a subcontractor company.
Most organisations focus on metrics of sub-processes which are also irrelevant to the customer. A perfect example of this is code coverage. Such metrics are ok, but they are often overemphasized. Real focus should be on the opposite quadrant: end-2-end metrics which matter to the customer, such as time-to-market, defect trends, business value delivered, customer retention, etc.
Let’s end this blog post with another example of the misleading nature of metrics: the Hungarian soccer team has not conceded a single goal between 1973 and 2015 on European Soccer Championships. Are we happy?*
*Not quite, since we haven’t even made it to these championships.
Further recommended reading on the topic by Hubstaff: Agile Metrics: What To Measure and Why They’re Important